

One of the most significant bullish signs for Bitcoin in the long-term is the renewed interest in the digital asset by institutional investors around the world. Bitcoin Treasuries in publicly traded companies have been acquiring massive sums of coins throughout 2020.
Grayscale Bitcoin Trust is by far the largest after scoring more than 440,000 BTC, worth more than $5 billion at current prices. More recently, Square, a company founded by the CEO of Twitter, acquired $50 million worth of BTC.
Even more recently, Stone Ridge, a multi-billionaire asset management company purchased $115 million worth of the digital asset, around 10,000 BTC. There is a clear interest in Bitcoin by big players.
PlanB, known for creating the Bitcoin Stock-to-Flow model, explains that all the institutional buying is a huge bullish sign but we need patience until the next mega breakout.
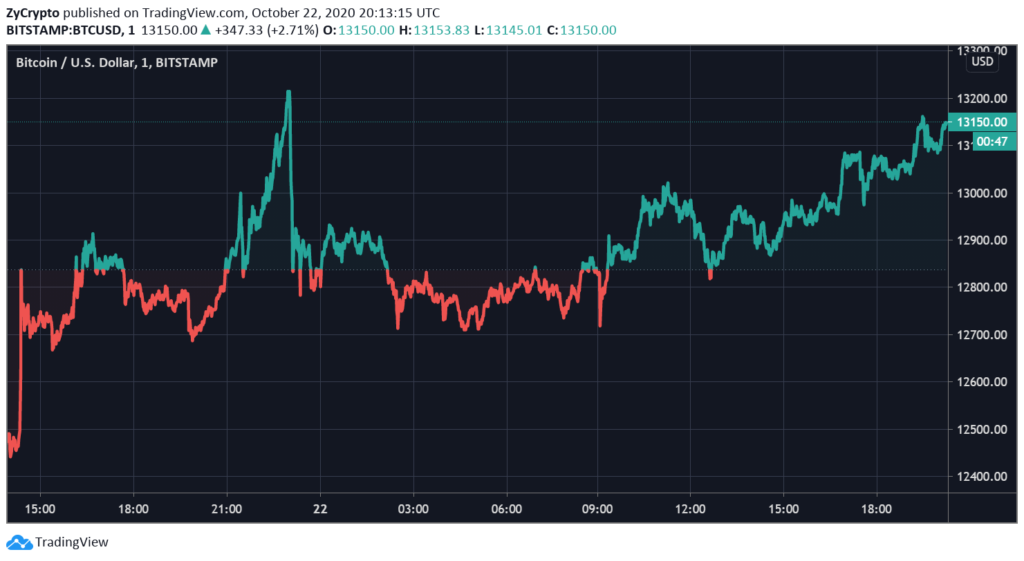 BTCUSD Chart By TradingView
Other Bullish Signs in Favor of Bitcoin
From a technical standpoint, Bitcoin is currently striving to stay above $13,000, a critical support level, and to climb above $13,500. We could see the digital asset trade between these two levels for the next few weeks before a clear breakout.
However, it seems that bulls have the upper hand as most indicators and on-chain metrics are in favor of Bitcoin. For instance, on the daily chart, bulls have managed to turn the 50-SMA, 100-SMA, and 200-SMA into support levels while the MACD continues on its bullish path.
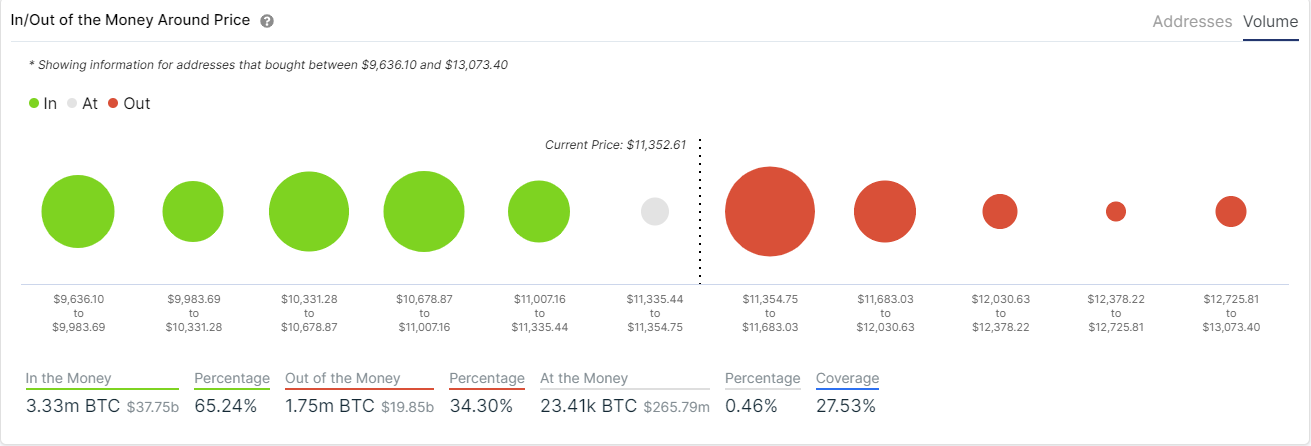
One of the best on-chain metrics to determine potential resistance or support levels is the In/Out of the Money Around Price chart provided by IntoTheBlock. Here we can observe how BTC was bought at a specific price range. The IOMAP chart clearly shows a strong resistance area between $12,378 and $12,725.
However, it seems that above this area, there is practically no resistance well until $13,300 which would indicate that a breakout past $13,500 can easily drive Bitcoin towards $15,000.
Mohit Sorout, the founder of Bitazu Capital, recently posted a tweet including a Bitcoin chart stating that a clear breakout would most likely lead BTC to $20,000 within 3 months. It seems that one of the most notable bullish signs was the breakout above a long-term trendline formed at the end of 2017.


