
The federal agency in charge of regulating digital assets in Japan, the Financial Services Agency (FSA), has given OMG Network, formerly known as OmiseGo, the green light for the sale of its native token in the nation. As a result, Japan-based cryptocurrency exchange GMO Coin announced in a recent blog post that it will list OMG on its retail trading platform.
By adding support to this altcoin, the FSA-licensed cryptocurrency exchange opens the gates for a whole new market to buy, sell, and accumulate it. The move was welcomed by investors who rushed to exchanges to get a piece of the price action.
The rising buying pressure was significant enough to push OMG’s price up over 7.5% in the last 36 hours to a new monthly high of $1.77. Now, different metrics suggest that the scaling solution token is poised to advance further.
OMG Surges to a New Monthly High. (Source: TradingView)
Weak Resistance Ahead of OmiseGo
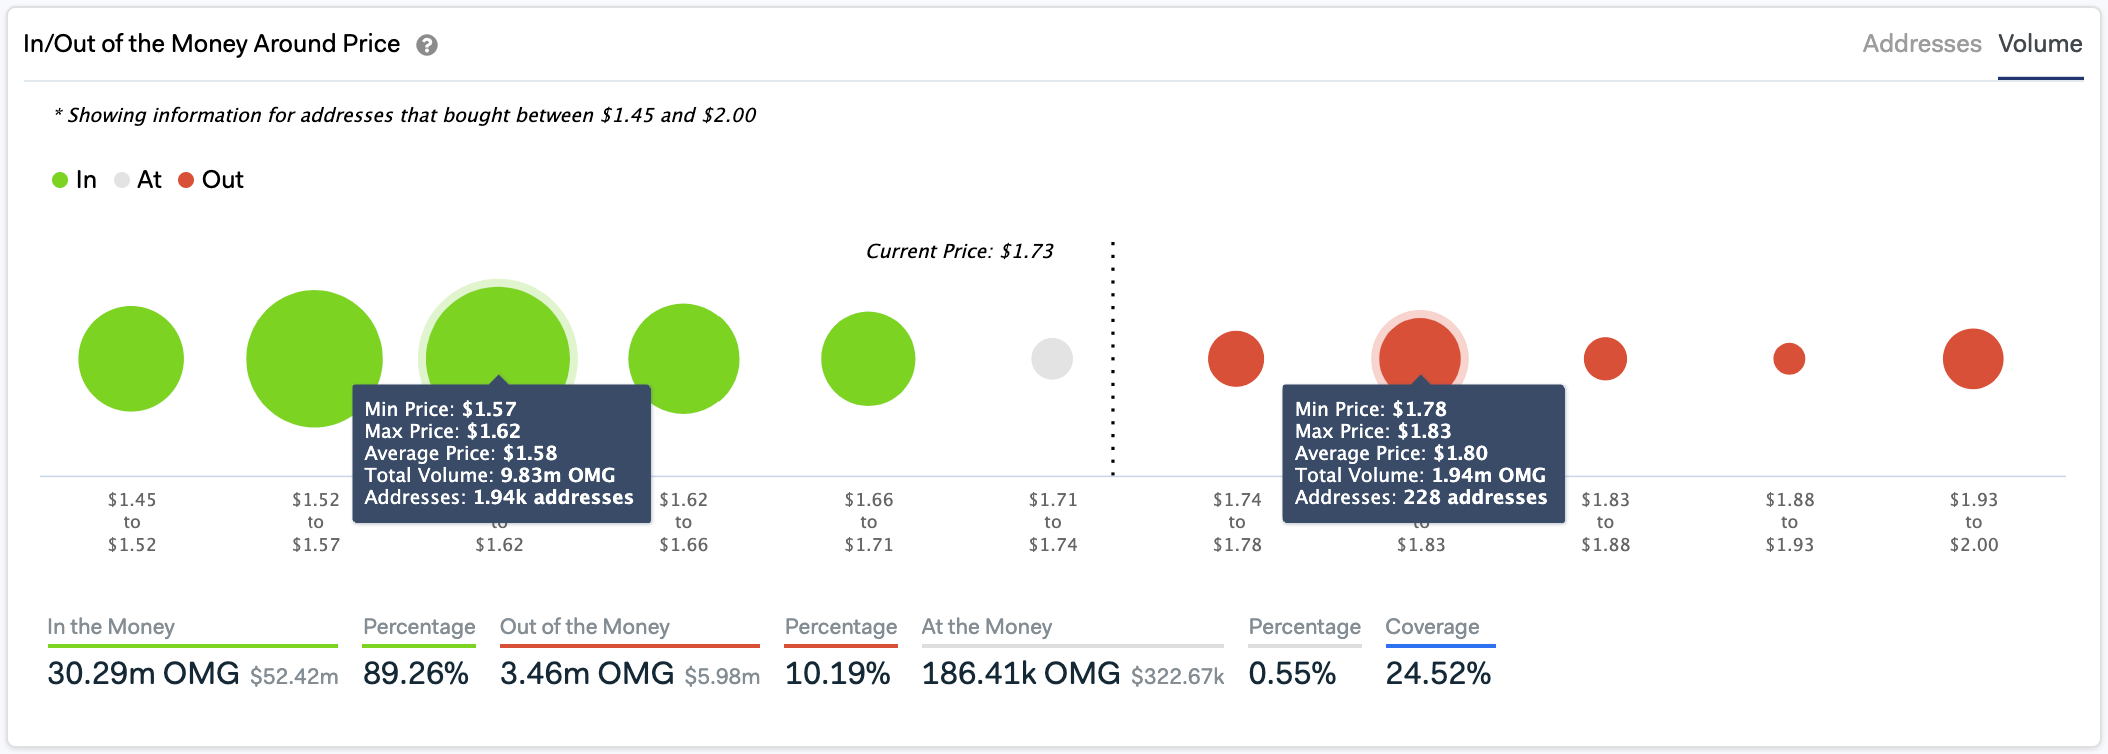
IntoTheBlock’s “In/Out of the Money Around Price” (IOMAP) model reveals that there is only one considerable resistance wall ahead of OMG Network that could prevent it from rising towards $2.6.
Based on this on-chain metric, nearly 230 addresses had previously purchased over 1.9 million OMG between $1.78 and $1.83. This supply barrier may have the ability to reject any upwards price movement because holders within this range would likely try to break even in the event of an upswing.
Moving past it, however, leaves the value transfer altcoin open to rise to the next significant area of interest around $2.6 to $3.
OMG Faces Weak Resistance Ahead. (Source: IntoTheBlock)
On the flip side, the IOMAP cohorts show that a massive supply wall lies between $1.57 and $1.62 that may prevent prices from falling further in the event of a correction. Around this price range, nearly 2,000 addresses bought over more than 9.8 million OMG.
The considerable number of holders within this range would likely try to remain profitable if prices were to depreciate. They may even buy more tokens to allow it to rebound.
Technicals Turn Bullish
The Tom Demark (TD) Sequential indicator on OMG’s 1-week chart adds credence to the bullish. This technical indexes presented a buy signal the moment the current green two candlestick began trading above the preceding green one candle.
A further spike in demand for this cryptocurrency could trigger a new countdown all the way up to a green nine candlestick. This means that an increase in the buying pressure behind OMG could translate to seven weekly candlesticks of upward momentum.
TD Sequential Turns Bullish On OMG's 1-Week Chart. (Source: TradingView)
On its way up, the TD setup estimates that OMG could find strong resistance around the setup trendline, which is sitting at $2.7. This is around the same price level where the IOMAP cohorts show the most significant supply barrier ahead of this cryptocurrency.
It is worth noting that based on the TD Sequential, a red two candlestick trading below a preceding red one candle can jeopardize the bullish outlook. Until this happens, OMG remains bullish from a weekly chart perspective.
Featured Image by Depositphotos
Price tags: omgusd, omgbtc
Chart from TradingView.com


