
Bitcoin’s recent consolidation has left analysts and investors alike largely puzzled as to what comes next.
Nothing is a better sign of this than the funding rates of BTC futures markets, which are converging towards 0.00%. This shows that both the long and short side of the market is not overvalued.
An analyst has suggested that a retracement to $5,000 is possible as a key macro momentum indicator is poised to flip bearish for the first time since the second half of 2018.
Related Reading: Crypto Tidbits: BTC Fails at $10k, Ethereum Coins Explode, Coinbase Looks to Add 18 Altcoins
Bitcoin Trend Indicator Is About to Trend Bearish
In the middle of 2019, Bitcoin broke past resistance after resistance in rapid succession. The price action was so strong that many expected for BTC to set a new all-time high that year, with some tossing out high price predictions of $50,000 — or more.
Yet there were some analysts forecasting a retracement. One said that Bitcoin would fall to $6,400 — a drop of approximately 50% from the price at the time he made that call.
That same analyst recently suggested that there’s potential for Bitcoin to retrace 50% in the coming months, which would imply a low of ~$5,000 prior to a bounce.
The chart he shared below illustrates this sentiment well. It shows Bitcoin’s macro price action alongside a channel/momentum indicator that has attempted to determine in what macro direction BTC is trending.
Each time the channel flipped red over the past five years, the price of Bitcoin retraced 50% — hence the forecast of a potential retracement to the $5,000s.
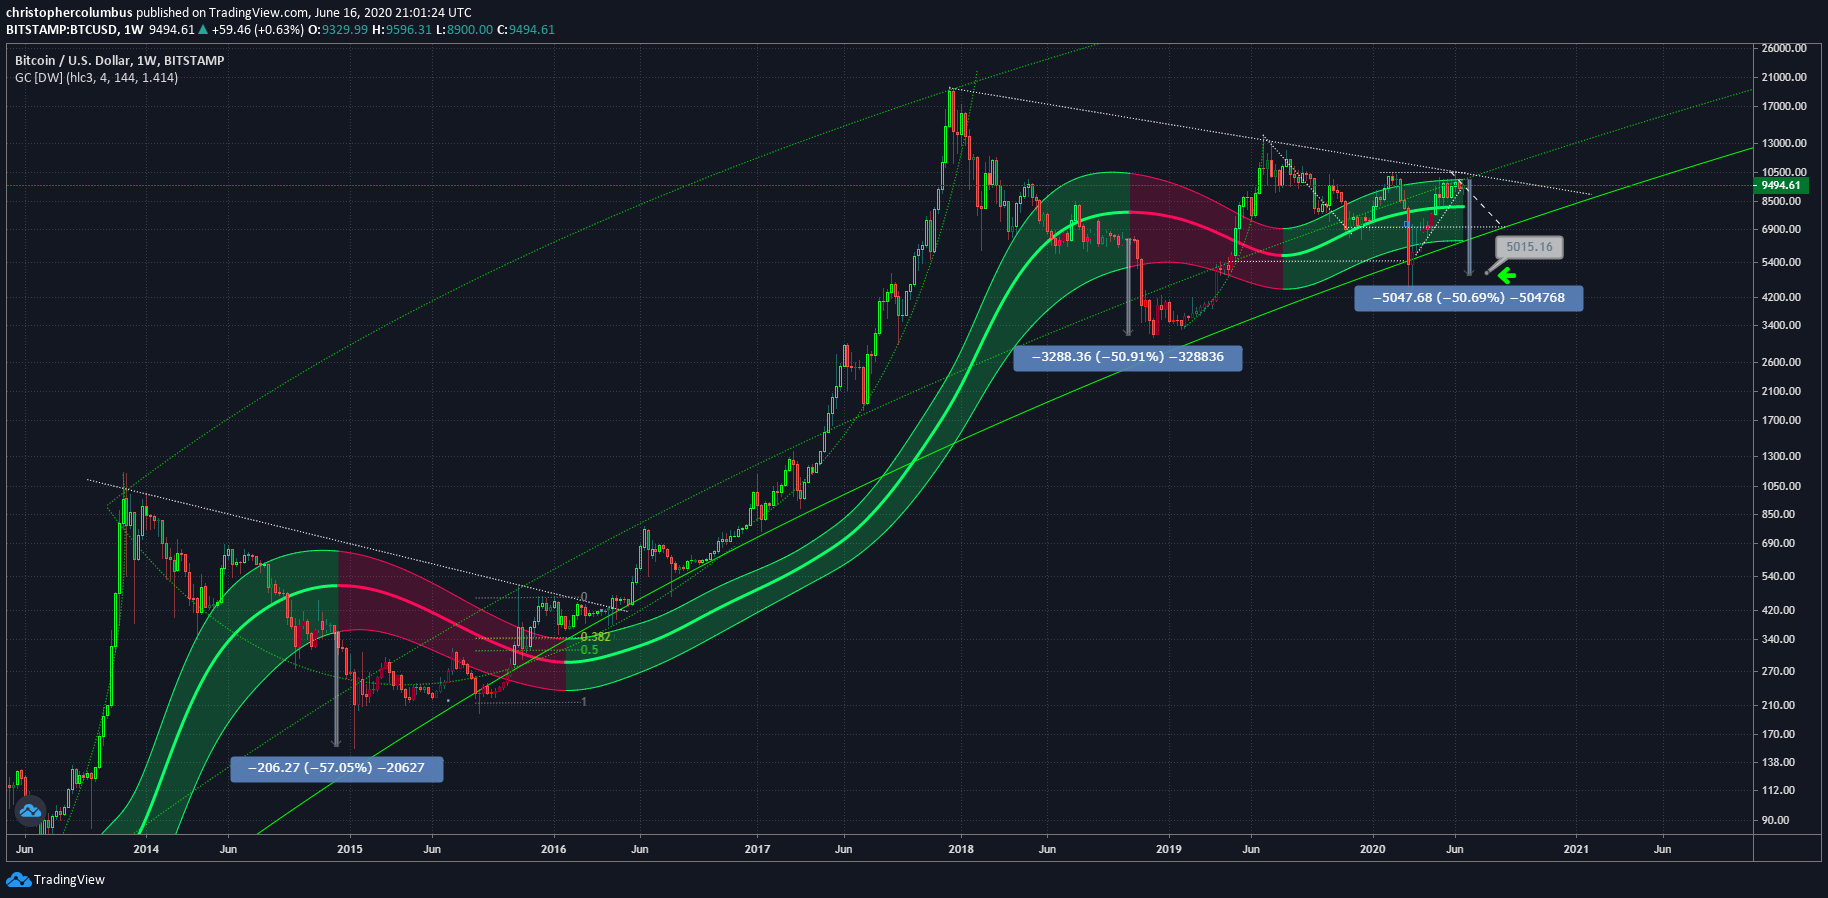
Macro s price chart from trader "Dave the Wave" (@Davonwave on Twitter). Chart from TradingView.com.
Importantly, the indicator that the trader shared is lagging. That’s to say, Bitcoin may actually trend higher while the channel is red, That doesn’t take away from the importance of the indicator, though, especially considering its historical precedent.
This Time Is Different
The indicator depicted by the analyst is seemingly poised to roll over. Yet there is a confluence of positive technical and fundamental factors that signal Bitcoin will move higher out of the ongoing consolidation.
Per previous reports from NewsBTC, BTChas traded in nine five-week, 20% consolidations over the past two years. A data analyst found that 77% of those patterns have broken higher, suggesting the ongoing consolidation has a high historical chance of breaking higher.
In terms of fundamentals, JPMorgan is currently expecting a 47% rally in the value of equities, despite the S&P 500 already rallying 40% from the March lows.
Bitcoin will benefit if equities rally further due to the relatively tight correlation between cryptocurrencies and traditional financial markets that has formed over recent months.
Related Reading: BTC Hash Rate Recovers to Pre-Halving Levels, But a Chinese Mine Just Burned Down
Featured Image from Shutterstock
Price tags: xbtusd, btcusd, btcusdt
Technical charts from Tradingview.com
Last 2 Times This Signal Was Seen, Bitcoin Dove 50%. It's About to Happen Again


