
Bitcoin price regained momentum and broke the $15,800 resistance against the US Dollar. BTC is trading nicely above the $15,500 support and the bulls seem to be aiming a break above $16,000.
- Bitcoin gained over 2% and it spiked above the $15,850 resistance zone.
- The price is currently trading well above the $15,500 support and the 100 hourly simple moving average.
- There is a crucial bullish trend line forming with support near $15,540 on the hourly chart of the BTC/USD pair (data feed from Kraken).
- The pair could rally above $15,850 and $16,000 as long as it is above the 100 hourly SMA.
Bitcoin Price Is Showing Positive Signs
Yesterday, we discussed the importance of the 100 hourly simple moving average and $15,200 for bitcoin price. BTC remained well bid above the 100 hourly SMA, it climbed above the $15,500 and $15,600 resistance levels.
The upward move gained pace above the $15,700 level and the price even spiked above the $15,850 resistance. It traded close to the $16,000 resistance and formed a new weekly high at $15,995. Bitcoin is currently correcting lower and trading below $15,850.
There was a break below the 23.6% Fib retracement level of the recent increase from the $15,098 swing low to $15,995 high. The first key support is near the $15,600 level. The next major support is near the $15,550 level.
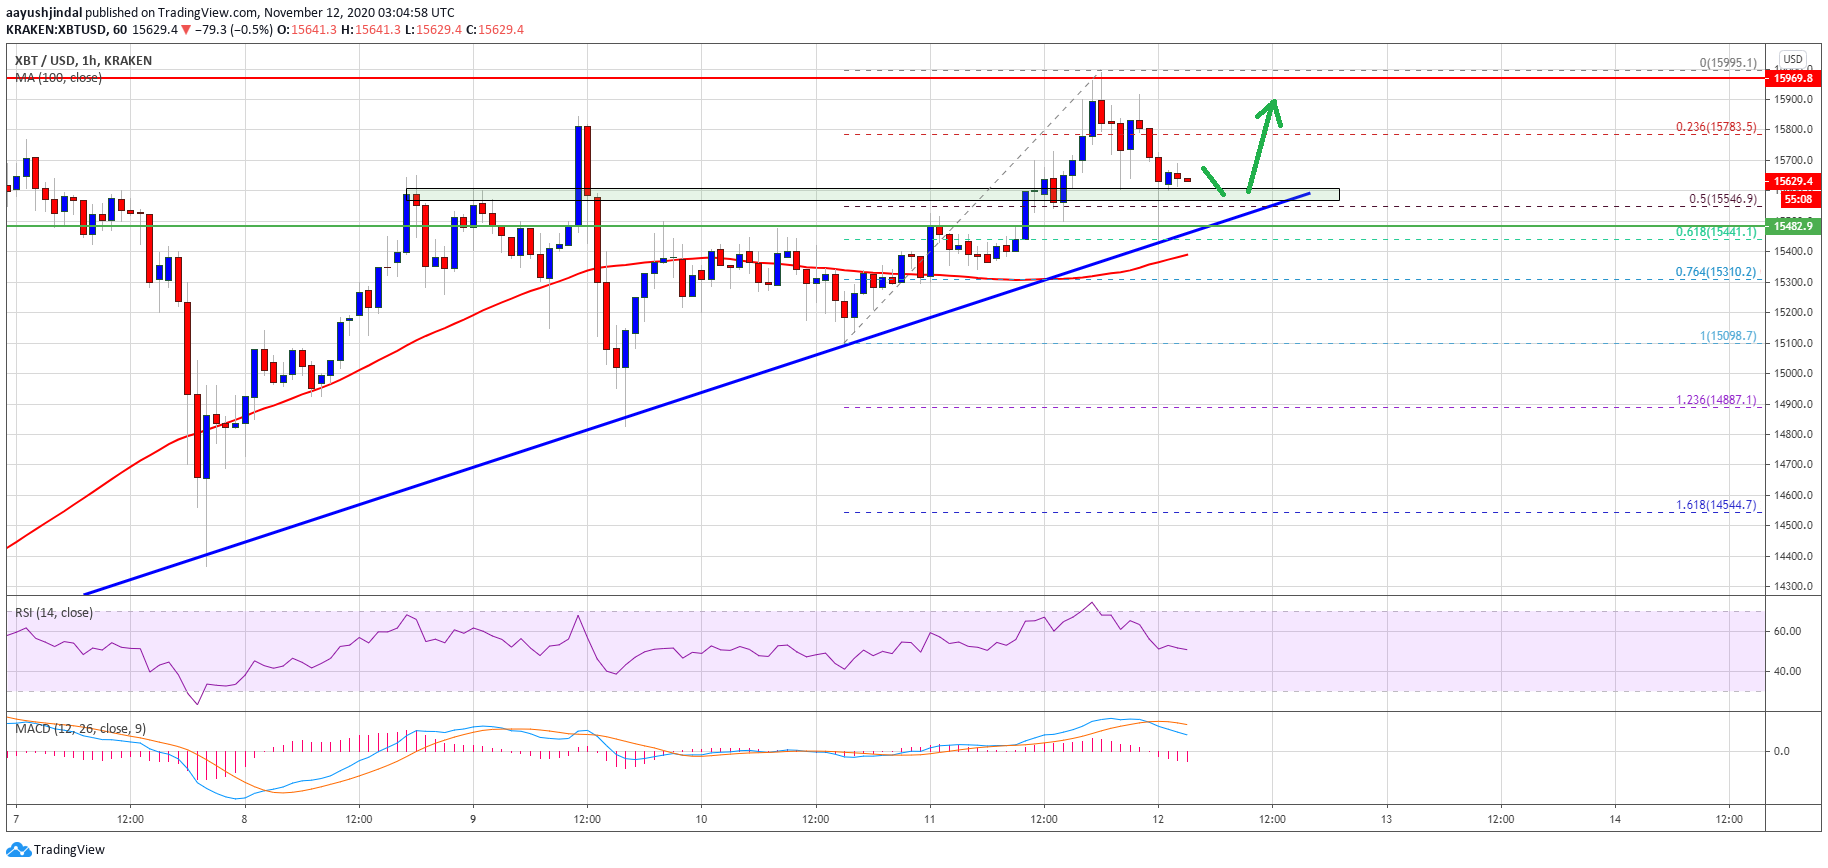
Source: BTCUSD on TradingView.com
There is also a crucial bullish trend line forming with support near $15,540 on the hourly chart of the BTC/USD pair. The trend line is close to the 50% Fib retracement level of the recent increase from the $15,098 swing low to $15,995 high.
On the upside, an immediate resistance is near $15,800, above which the price attempt a break above the $16,000 resistance. If there is a clear break above $16,000, the price could rally towards the $16,200 and $16,500 levels.
Repeat Role of 100 Hourly SMA for BTC?
If bitcoin fails to clear the $15,800 resistance, there could be a short-term downside correction. The first key support is near the trend line and $15,550.
The next major support is near the 100 hourly SMA at $15,400. If there is a clear break below the trend line support and the 100 hourly SMA, the price could start a fresh decline towards the $15,000 support.
Technical indicators:
Hourly MACD – The MACD is slowly moving in the bearish zone.
Hourly RSI (Relative Strength Index) – The RSI for BTC/USD is currently above the 50 level.
Major Support Levels – $15,600, followed by $15,550.
Major Resistance Levels – $15,800, $15,850 and $16,000.


