
VeChain has enjoyed an impressive bull rally thus far this year, despite the chaos caused by the ongoing pandemic. The VeChainThor technology continues to expand to a wide range of industries, providing solutions to real-world problems.
For this reason, investors are seemingly giving VET their vote of confidence.
This market behavior has been reflected in the price of this altcoin, which is up 1,100% since March’s Black Thursday. Now, a particular chart pattern suggests that the blockchain-based supply chain management token is poised to advance further.
VeChain Aims For Higher Highs
VET’s price action appears to be developing a descending triangle over the past couple of weeks.
A horizontal trendline formed along with the swing lows while a descending trendline was created along with the swing highs. By measuring the distance between the highest points of this technical formation and adding it to the breakout point, it anticipates an upside target of 25.6%.
Over the past few hours, VeChain seems to have broken out of this technical formation, suggesting that it is marching towards $0.22. This is the target presented by the descending triangle pattern.
VeChain Breaks Out of a Descending Triangle. (Source: TradingView)
Nevertheless, the TD sequential indicator estimates that this cryptocurrency’s price will suffer a correction before it is able to finally break out.
This technical index presented a sell signal in the form of a green nine candlestick on VET’s 4-hour chart.
The bearish formation can lead to a one to four candlesticks correction or the beginning of a new downward countdown.
VeChain May Retrace Before Advancing Further. (Source: TradingView)
It is worth mentioning that in the last few weeks each time the TD setup presented a sell signal around the hypothenuse of the triangle, prices retraced to the x-axis before bouncing back. If history repeats itself, VET may drop to the $0.015 support level and then rebound to overhead resistance—and possibly breakout.
On Top of Massive Support
Despite the high probability of a correction before higher highs, IntoTheBlock’s “In/Out of the Money Around Price” (IOMAP) model suggests that VeChain sits on top of a massive supply barrier.
Based on this on-chain metric, roughly 3,000 addresses had previously purchased nearly 14 million VET between $0.0167 and $0.0188.
Such a massive area of interest may have the ability to absorb any downward pressure. Holders within this price range will likely try to remain profitable in their long positions.
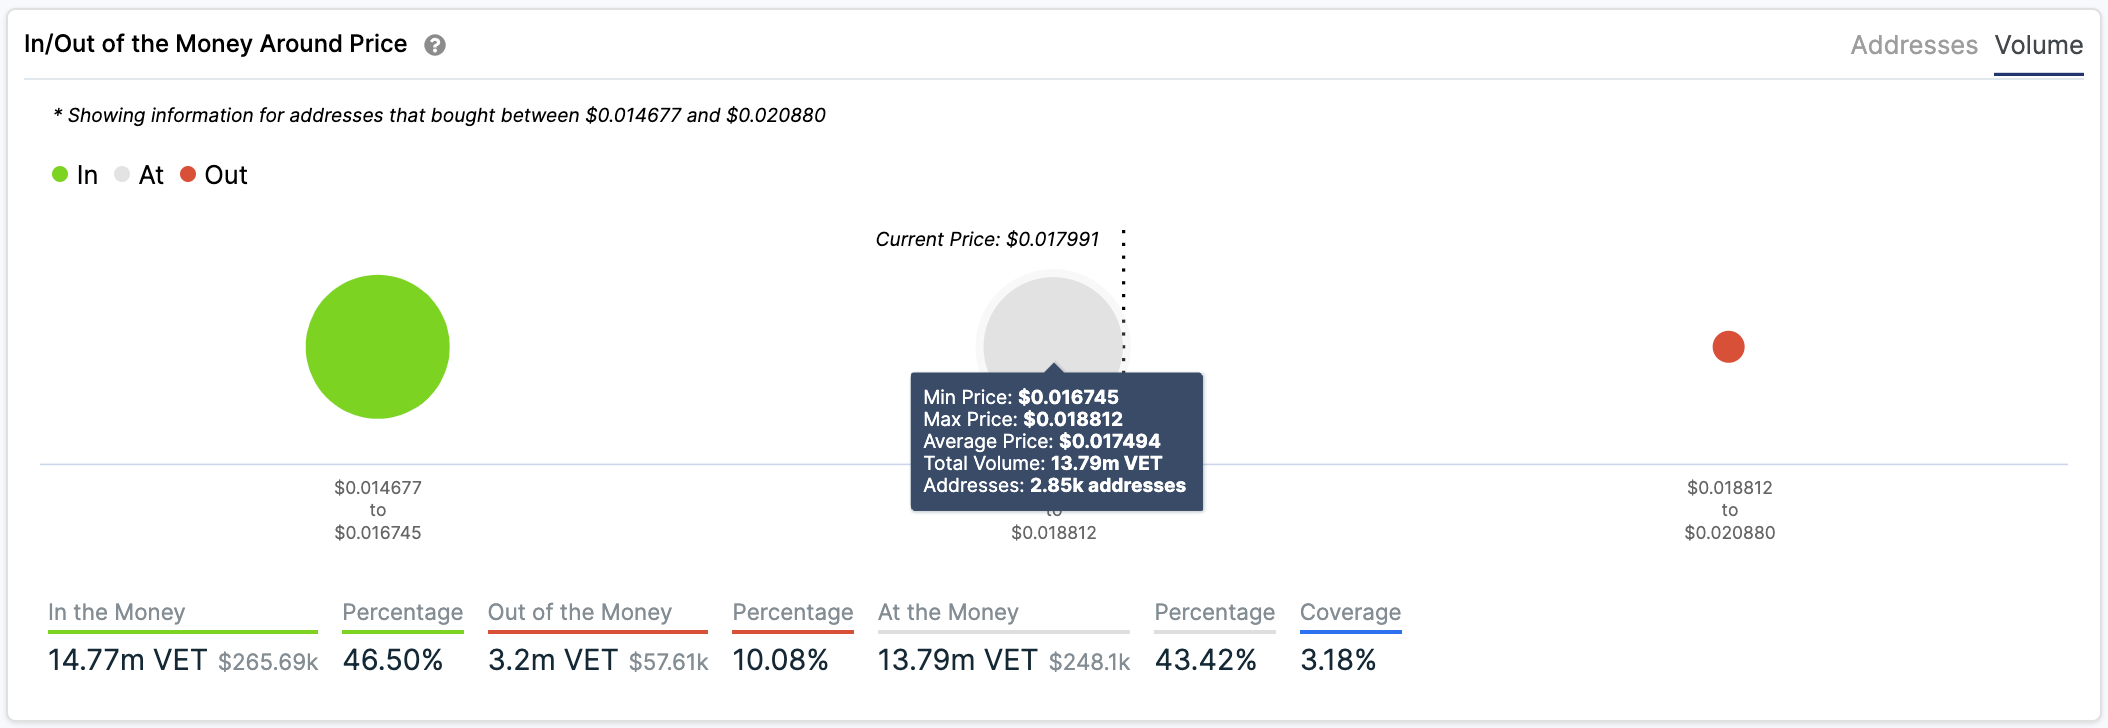
VeChain Sits on Top of Massive Supply Barrier. (Source: IntoTheBlock)
Breaking through this support wall, however, could see VeChain retrace to the x-axis of the descending triangle. In either case, setting up stop and limit orders along the way will position a trader to take advantage of VeChain’s potential upside.
Featured Image by Depositphotos
Price tags: vetusd, vetbtc
Chart from TradingView.com


